Go: Instrumenting the HTTP service with Elastic APM
Elastic APM is an application performance monitoring product Elastic, the makers of Elasticsearch, and most notably the ELK stack (Elasticsearch, Logstash, Kibana). APM is another plug and play product of theirs, that hooks up to your existing ELK installation and provides endpoints for application agents to receive performance metrics data.
Elastic APM provides a Go agent, which we will use to instrument various parts of our code. The instrumentation will help us not only with performance metrics, but with debugging and optimization of our applications as well.
Wrapping our existing handler
We already wrapped the HTTP handler with our own, that adds IP information into the
request context. APM works in the same way, providing their own wrapper for a http.Handler.
Since we can reasonably assume that we will need other wrapers in the future, we will
create another function under internal/wrap.go to keep main() cleaner:
import (
	"strings"

	"net/http"

	"go.elastic.co/apm/module/apmhttp"
)

// WrapAll wraps a http.Handler with all needed handlers for our service
func WrapAll(h http.Handler) http.Handler {
	h = WrapWithIP(h)
	h = apmhttp.Wrap(h)
	return h
}

...
The code imports the APM module with the HTTP handler wrapper. There are also routing framework specific wrappers available, notably: httprouter, gorilla, cgi, gin, echo, beego,… The full list is quite extensive, you can review them on elastic/apm-agent-go.
So, as we have WrapAll defined now, we can fix our generator for main.go:
--- a/templates/cmd_main.go.tpl
+++ b/templates/cmd_main.go.tpl
@@ -48,5 +48,5 @@ func main() {
        twirpHandler := ${SERVICE}.New${SERVICE_CAMEL}ServiceServer(srv, nil)

        log.Println("Starting service on port :3000")
-       http.ListenAndServe(":3000", internal.WrapWithIP(twirpHandler))
+       http.ListenAndServe(":3000", internal.WrapAll(twirpHandler))
 }
Run make to rebuild your app with HTTP server instrumentation.
The wrapper takes care of creating what is called a “Transaction”. A transaction in our case consists of the incoming request to our handler, all the way until the completion of that request. For each request, various data is logged to Elastic APM, the most obvious one of which is the request duration.
Logging errors too
Any request coming to your service may error out. When creating twirpHandler, we omit
the second parameter to the NewXXXServiceServer call, a parameter of *twirp.ServerHooks
type. This structure defines various hooks implemented by the Twirp RPC server handler.
We are especially interested in the Error hook:
type ServerHooks struct {
	// Error hook is called when an error occurs while handling a request. The
	// Error is passed as argument to the hook.
	Error func(context.Context, Error) context.Context
}
Particularly, we want to log the error with another Elastic APM API call, CaptureError.
Let’s prepare a function that will construct an instance of *twirp.ServerHooks in our
internal package with a defined error logger, under internal/twirp.go:
package internal

import (
	"context"

	"github.com/twitchtv/twirp"
	"go.elastic.co/apm"
)

func NewServerHooks() *twirp.ServerHooks {
	return &twirp.ServerHooks{
		Error: func(ctx context.Context, err twirp.Error) context.Context {
			apm.CaptureError(ctx, err).Send()
			return ctx
		},
	}
}
The function apm.CaptureError takes the second parameter of the type error. As the
interface twirp.Error is a superset of the standard error type, it’s already compatible
with this parameter.
In our cmd_main.tpl we just replace the nil parameter with internal.NewServerHooks().
-       twirpHandler := ${SERVICE}.New${SERVICE_CAMEL}ServiceServer(srv, nil)
+       twirpHandler := ${SERVICE}.New${SERVICE_CAMEL}ServiceServer(srv, internal.NewServerHooks())
Setting up ELK
There’s an utility docker image that provides a bundled ELK installation:
- sebp/elk docker hub image,
- spujadas/elk-docker github repository
The container supports ELK up to version 7.4.0. It should be easy enough to add it into
our development docker-compose.yml file. Append the following under services:
  elk:
    image: sebp/elk
And run the following in order:
sysctl vm.max_map_count=512000
docker-compose up -d
It possibly takes a few minutes in order for ELK to be reachable. When it completes,
you can open http://localhost:5601 in your browser, and you’ll find yourself on the
ELK console. Now we need to add APM.
Setting up APM
Turns out, we don’t really need much for APM, just a small config file that tells it
where the elasticsearch instance is where it wants to send data to. Let’s create
docker/elk, and inside apm-server.yml:
apm-server:
  host: "0.0.0.0:8200"

output.elasticsearch:
  hosts: ["elk:9200"]
And the Dockerfile (we could avoid this with a volume mount, but it’s trivial):
FROM docker.elastic.co/apm/apm-server:7.4.0

USER root
COPY apm-server.yml /usr/share/apm-server/apm-server.yml
RUN chown root:apm-server /usr/share/apm-server/apm-server.yml

USER apm-server
And finally, add APM to our docker-compose.yml file:
  apm:
    build: docker/apm
Re-run docker-compose up -d to start the APM service.
Configuring our sender
We have configured ELK and APM, now we need to configure our service to send data to APM. This is done with two environment variables, which we can add to our service, just after DB_DSN:
     environment:
       DB_DSN: "stats:stats@tcp(db:3306)/stats"
+      ELASTIC_APM_SERVICE_NAME: "stats"
+      ELASTIC_APM_SERVER_URL: "http://apm:8200"
     command: [
Run docker-compose up -d to reload the changed services.
Now we can re-run the curl request which we used for testing:
#!/bin/bash
payload='{
  "property": "news",
  "section": 1,
  "id": 1
}'

curl -s -X POST -H 'Content-Type: application/json' \
     -H "X-Real-IP: 9.9.9.9" \
     http://172.22.0.5:3000/twirp/stats.StatsService/Push \
     -d "$payload" | jq .
Be sure to update the IP of the service by running docker inspect microservice_stats_1
and finding the actual IPAddress of the service. Run the curl request a couple of times,
so it will generate/feed some data into APM.
If you don’t see any requests to APM from Kibana, make sure your service build is up to
date (run make docker.stats), and then run docker-compose up -d again to recreate it.
Reviewing ELK data
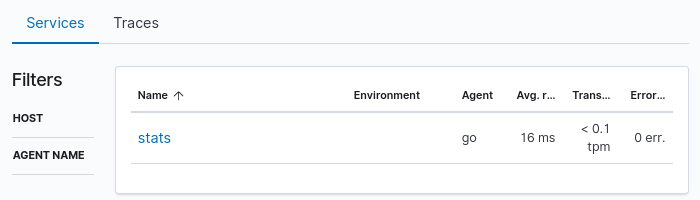
As we started collecting ELK data for our service, it’s a good time to review a few key features. After opening up the APM menu from the left side-bar, we get a listing of every service that we are logging, along with basic metrics like average response time, transactions/minute, and errors/minute.
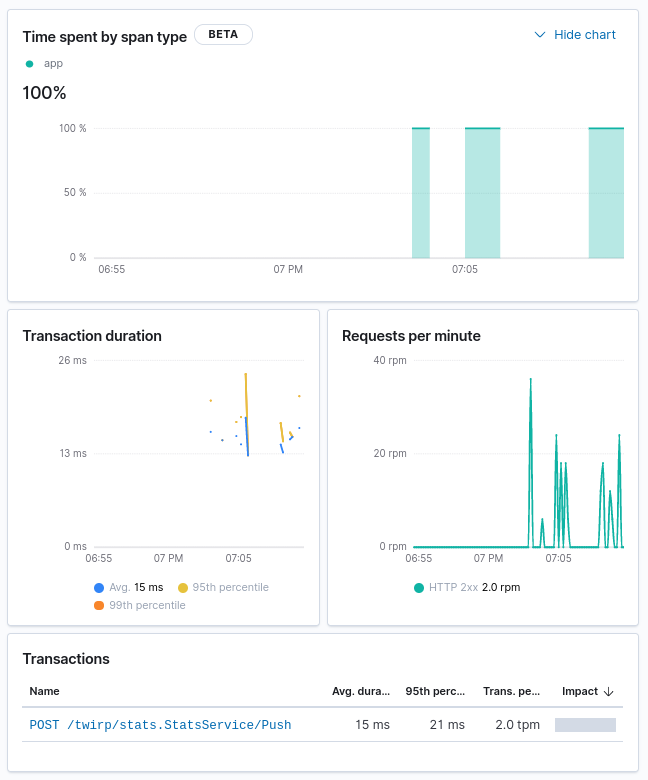
After this, we can drill down into our service. Set an interval for the last 15 minutes, so you get some usable graphs on the next screen. The graphs show the overall request rate and durations for your service, and at the end of the page - individual transactions.
Drilling down into transactions gives us observability beyond the simple access log line. APM aggregates our requests and provides a distribution graph, so you can figure out which requests took an extraordinary amount of time. After all, we should be optimizing the 95th or 99th percentile, and not just the overall average case. The low hanging fruit usually comes from edge cases which aren’t optimized well.
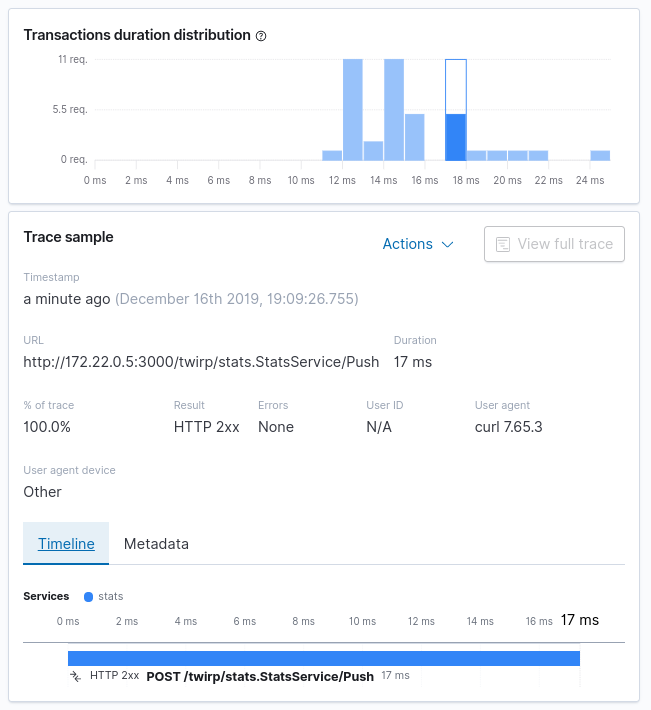
There are two important things to note below:
- Timeline
- Metadata
The timeline currently contains only our transaction, but we will enrich this with spans. For example, a span would be an SQL query, and the time it took to execute it. We can then subdivide the transaction into implementation details and answer questions like:
- How many queries against the database did the request perform?
- What was the longest database query inside the RPC?
- How many HTTP requests did we make?
- What was the longest HTTP request inside the RPC?
- How long does connecting to a database take?
The metadata contains the complete HTTP request data, information about the host/container where our service is running, which Go version our service was built with, which arguments our service was run with, and we can extend this data with our own custom fields.
Our next step will be to instrument our database, so we can see our database queries and things like connect latency. With that, we will have enough data about our service, so that we can optimize and improve it.
This article is part of a Advent of Go Microservices book. I’ll be publishing one article each day leading up to christmas. Please consider buying the ebook to support my writing, and reach out to me with feedback which can make the articles more useful for you.
All the articles from the series are listed on the advent2019 tag.
While I have you here...
It would be great if you buy one of my books:
- Go with Databases
- Advent of Go Microservices
- API Foundations in Go
- 12 Factor Apps with Docker and Go
For business inqueries, send me an email. I'm available for consultany/freelance work. See my page for more detail..
Want to stay up to date with new posts?
Stay up to date with new posts about Docker, Go, JavaScript and my thoughts on Technology. I post about twice per month, and notify you when I post. You can also follow me on my Twitter if you prefer.