
Benchmarking Go programs
Benchmarking is an important step in writing software. This may extend beyond the scope of your Go program, but attention should also be given to the Go program itself. If you’re writing APIs or if you’re implementing a parser for a specific file format - benchmarking will tell you how performant your implementation is.
Writing tests in Go is relatively simple - you create a file with the suffix
_test.go, and when you run go test it will run the tests contained within.
But there’s a specific feature to Go, benchmarks. You write the benchmarks
in the same way as you would write tests, but change the function signature
from this:
func TestScannerTextBlock(t *testing.T) {
to this:
func BenchmarkScannerTextBlock(b *testing.B) {
As you see, the Testing functions have a “Test” prefix for the function name. In comparison, the Benchmark functions have a “Benchmark” prefix. What changes is also the argument from *testing.T to *testing.B. The types provide functionality to manage tests and benchmarks.
A feature complete example of a benchmark would be this:
func BenchmarkStringJoin1(b *testing.B) {
	b.ReportAllocs()
	input := []string{"Hello", "World"}
	for i := 0; i < b.N; i++ {
		result := strings.Join(input, " ")
		if result != "Hello World" {
			b.Error("Unexpected result: " + result)
		}
	}
}
And you could run your benchmark like this:
# go test -run=xxx -bench=. -cpuprofile profile_cpu.out
The above command will skip tests (unless you’ve named them ‘xxx’), run all benchmarks, and create a CPU profile for the benchmarking run.
"Benchmarking with Go: It's just as simple as writing tests #golang" via @TitPetric
Click to Tweet
There are a few things to note in that example:
1. Testing in the benchmark
You can write a sanity check test inside the benchmark, which can error out of the benchmark if the results might be invalid. While this falls into the testing territory, there might be errors that can be caught this way from objects that maintain a state that changes over many requests / function calls.
Ir you detect an error, just call the b.Error function and the benchmarks will stop.
2. Benchmark intensity
The usual story when benchmarking code in other programming languages would be that
you would log the time taken for a loop, where you would set a loop limit by hand.
Go benchmarks are smarter in that respect - they provide a b.N integer that tells
the benchmark how many loops it should do, so it roughly takes one second (by default).
  -test.benchtime duration
        approximate run time for each benchmark (default 1s)
3. Reporting Allocations
When running a benchmark, Go can log and report allocations which you make. This logging
and reporting is triggered with a call to b.ReportAllocs(). The allocation information may
signify a portion of your code that can be optimized in a way so it takes less
memory. After running the benchmark, some information regarding B/op and allocs/op
will be printed. The complete output might be similar to this:
BenchmarkStringJoin1-4 300000 4351 ns/op 32 B/op 2 allocs/op
This tells us that each iteration of the benchmark allocated on average 32 bytes, with two allocations. With this information we can set out to improve the test, hopefully allocating less memory.
func BenchmarkStringJoin2(b *testing.B) {
	b.ReportAllocs()
	input := []string{"Hello", "World"}
	join := func(strs []string, delim string) string {
		if len(strs) == 2 {
			return strs[0] + delim + strs[1];
		}
		return "";
	};
	for i := 0; i < b.N; i++ {
		result := join(input, " ")
		if result != "Hello World" {
			b.Error("Unexpected result: " + result)
		}
	}
}
The new benchmark produces the following results:
BenchmarkStringJoin2-4 500000 2440 ns/op 16 B/op 1 allocs/op
So, we managed to halve the allocations and speed up the function at the same time. Looking at
the implementation of strings.Join, I think that maybe the optimisation comes from the compiler itself.
The closure join which we introduced must be partially optimized and only the allocation for result
must remain. The compiler should produce something like this:
func BenchmarkStringJoin3(b *testing.B) {
	b.ReportAllocs()
	input := []string{"Hello", "World"}
	for i := 0; i < b.N; i++ {
		result := input[0] + " " + input[1];
		if result != "Hello World" {
			b.Error("Unexpected result: " + result)
		}
	}
}
Where the result would count as one allocation. But in fact, the compiler optimizes the above code even further:
BenchmarkStringJoin3-4 30000000 37.6 ns/op 0 B/op 0 allocs/op
This makes it a bit difficult to point at a specific allocation in the code, and pin point the difference.
For example, above you could say that declaring the input variable counts as an allocation - but if
you move it into the for loop, the results will vary. The allocs/op for the Join1 and Join2 tests would
stay the same, but the Test2, will increase in memory usage:
BenchmarkStringJoin2-4    500000   2440 ns/op   16 B/op   1 allocs/op
BenchmarkStringJoin2B-4   300000   5004 ns/op   48 B/op   2 allocs/op
Compiler optimizations are great, but it’s a bit tricky to deduce where the allocations might be coming from. In fact, with added optimisations in the compiler itself, the above benchmarks might improve with time, without changing a single line of source code.
Click to Tweet
For those not faint of heart, you can run the following command and take a look at what the compiler produces - pure unadulterated assembly.
# go tool objdump app.test > app.asm
4. CPU profile with pprof
While you have some basic information about the time it took for each function to be executed, you might want to drill down when benchmarking more complex functions. This way you might figure out, which function being called takes the most time.
The benchmark command above produces an app.test executable, along with a profile_cpu.out.
You can use the pprof tool from the go toolchain to analyze this output:
# go tool pprof app.test profile_cpu.out
Entering interactive mode (type "help" for commands)
(pprof) top10
8220ms of 10360ms total (79.34%)
Dropped 63 nodes (cum <= 51.80ms)
Showing top 10 nodes out of 54 (cum >= 160ms)
      flat  flat%   sum%        cum   cum%
    2410ms 23.26% 23.26%     4960ms 47.88%  runtime.concatstrings
    2180ms 21.04% 44.31%     2680ms 25.87%  runtime.mallocgc
    1200ms 11.58% 55.89%     1200ms 11.58%  runtime.memmove
     530ms  5.12% 61.00%      530ms  5.12%  runtime.memeqbody
     530ms  5.12% 66.12%     2540ms 24.52%  runtime.rawstringtmp
     470ms  4.54% 70.66%     2420ms 23.36%  strings.Join
     390ms  3.76% 74.42%     2330ms 22.49%  app.BenchmarkStringJoin3B
     180ms  1.74% 76.16%     1970ms 19.02%  runtime.rawstring
     170ms  1.64% 77.80%     5130ms 49.52%  runtime.concatstring3
     160ms  1.54% 79.34%      160ms  1.54%  runtime.eqstring
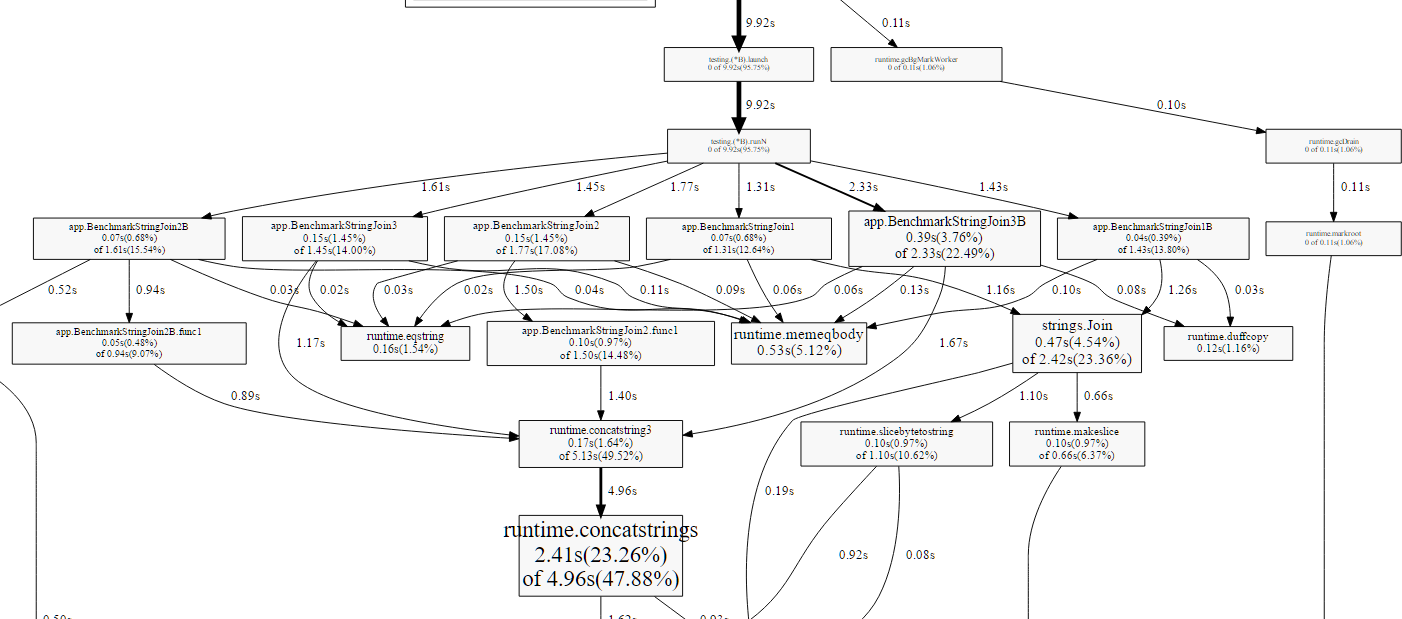
This doesn’t exactly show the complete call graph relationships, so you would know what
functions strings.Join is calling for example. Or why only BenchmarkStringJoin3B shows
up in the top 10. One way to get that is to generate it as a PDF or SVG with the same
pprof tool (you will need dot installed):
# go tool pprof -svg profile_cpu.out > profile_cpu.svg
# go tool pprof -pdf profile_cpu.out > profile_cpu.pdf
This will produce a callgraph PDF like this screenshot below:
As we declared several benchmarks, the output is slightly inconvenient if you’re interested only in one. You can run a specific benchmark and only get the output of that run. As Join2B was the worst benchmark, we want to drill into that one specifically:
go test -run=xxx -bench=BenchmarkStringJoin2B$ -cpuprofile profile_2b.out
go test -run=xxx -bench=BenchmarkStringJoin2$ -cpuprofile profile_2.out
go tool pprof -svg profile_2b.out > profile_2b.svg
go tool pprof -svg profile_2.out > profile_2.svg
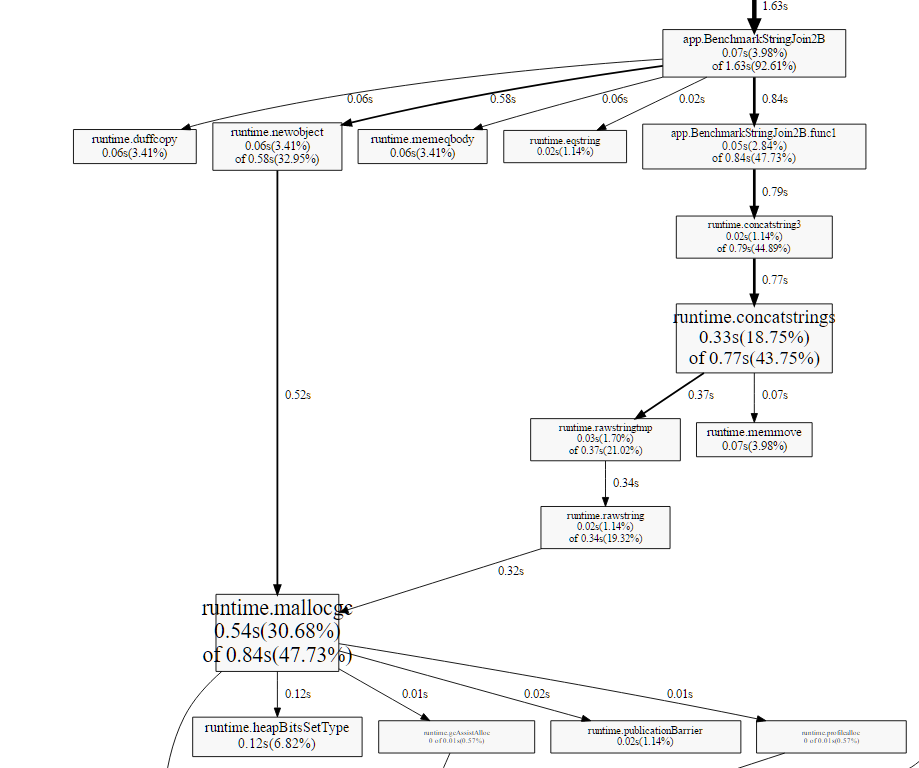
As the screenshot shows, the 2B benchmark is slower due to extra allocations in the benchmark function.
In comparison, the benchmark with the allocation outside the loop allocates memory under
runtime.concatstrings. It might still not be a great example of drilling down into the benchmark,
it might be better to use flame graphs.
A flame graph gives you the option to drill down top level functions by depth. This means that you can get a full flame graph like this and then drill down.
Click to Tweet
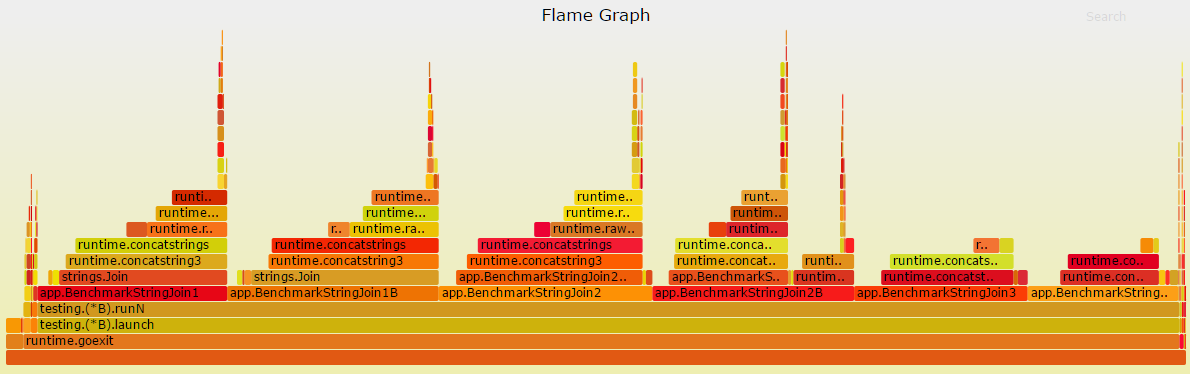
In order to drill down, you just click on the individual functions on the bottom, that are interesting to you. This will change the graph to display only descendant functions that have been invoked inside.
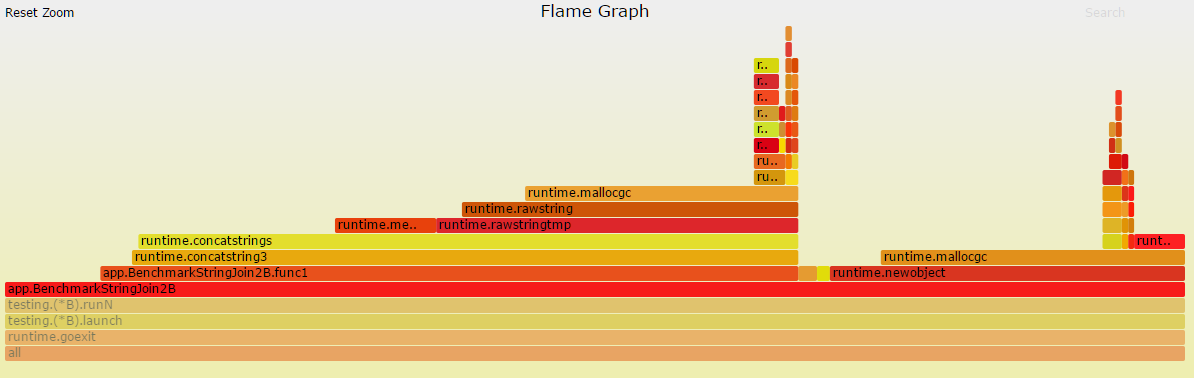
Generating the graph is as simple as generating the svg/pdf with pprof, but it does require some extra tooling, namely uber/go-torch, which uses a FlameGraph library by Brendan Gregg. A short bash script that checks out all the dependencies and generates the flame graph is bundled here:
#!/bin/bash
# install flamegraph scripts
if [ ! -d "/opt/flamegraph" ]; then
	echo "Installing flamegraph (git clone)"
	git clone --depth=1 https://github.com/brendangregg/FlameGraph.git /opt/flamegraph
fi

# install go-torch using docker
if [ ! -f "bin/go-torch" ]; then
	echo "Installing go-torch via docker"
	docker run --net=party --rm=true -it -v $(pwd)/bin:/go/bin golang go get github.com/uber/go-torch
	# or if you have go installed locally: go get github.com/uber/go-torch
fi

PATH="$PATH:/opt/flamegraph"
bin/go-torch -b profile_cpu.out -f profile_cpu.torch.svg
You can also check out the complete code samples on this github repo. While the above gives you an idea of how benchmarking works in Go, and how to usefully implement it, I’ll follow up with a more complex example. A good way to stay updated is to enter your e-mail below, or follow me on Twitter.
While I have you here...
It would be great if you buy one of my books:
- Go with Databases
- Advent of Go Microservices
- API Foundations in Go
- 12 Factor Apps with Docker and Go
For business inqueries, send me an email. I'm available for consultany/freelance work. See my page for more detail..
Want to stay up to date with new posts?
Stay up to date with new posts about Docker, Go, JavaScript and my thoughts on Technology. I post about twice per month, and notify you when I post. You can also follow me on my Twitter if you prefer.