
In process performance statistics with Redis
Every once in a while you need to do a sanity check of your code, how it performs and what you can do to improve it. This is most apparent with a code-base that is developed and refactored over a period of several years. There can be several problems that negatively impact performance due to dependency issues or legacy code that should have been removed but was forgotten during a refactoring sprint.
In effect, everybody is looking for low hanging fruit. Perhaps a slow performing SQL query, or just some processing which is taking O(P*N*M) due to sloppy code. The trick is to figure out where your code is wasting time. Sure, you can have profiled code with tools like xhprof, but the inherent verbosity can leave you with a mess of data which you'll never get around to analyze. I had gigabytes of profiler logs to prove it.
Lucky for me, I use check points in our own custom CMS software. Each time a specific core method or functionality is being used, a function gets called along with some descriptive argument. Think of it as assertions, except there's much less of them, up to about 30 per pageload, depending on the complexity of the page being loaded.
It took about 3 hours to write tooling to log this data into Redis. Or more specifically, since I am only interested in real-time data, I pushed each request and each check point call into a Redis channel (Pub/Sub). All that was left to do after that was write some tooling (colors, yay!) that listened to the data, processed it and tried to illustrate where the time was being spent. This was the final result.
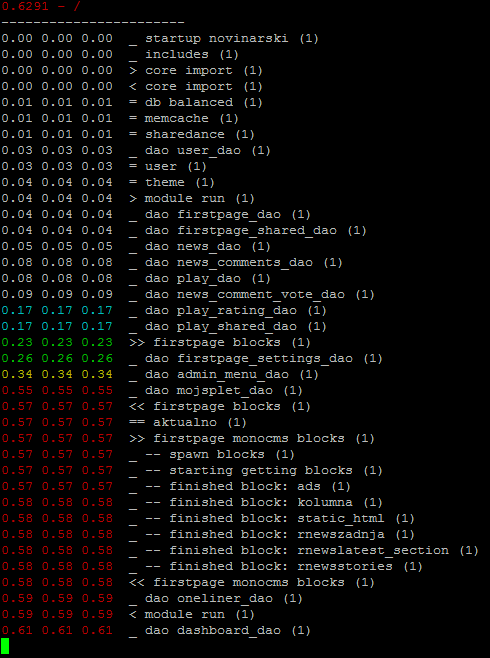
As far as low hanging fruit goes, this was good enough to shave 40ms over all requests, due to some legacy code that was still being used. Basically we included a cache file with menu data, which wasn't even used for a majority of requests. And the same cache file was loaded explicitly later in the execution, when the data was actually being used. The change, even if slight, is visible on each cluster machine.
And even looking at the output above I can see some clear performance problems in the "firstpage blocks" section, between admin_menu_dao and mojsplet_dao. A whole 0.34 seconds are getting wasted there, which represents about 55% of total time. I know the firstpage is a complex module, but I also know this could be shaved down to about 0.2 sec total without goat sacrifices.
I'm guessing there's a lot of redundant processing and ineffective big-O calls in there, along with some recursion from what I remember. Either way, the affected code base in that area is perhaps 50-100kb, so it shouldn't be hard to track down the badly performing code and optimize it away. Not bad for 3 hours of work and about a pint of coffee.
- Tit Petric
While I have you here...
It would be great if you buy one of my books:
- Go with Databases
- Advent of Go Microservices
- API Foundations in Go
- 12 Factor Apps with Docker and Go
Feel free to send me an email if you want to book my time for consultancy/freelance services. I'm great at APIs, Go, Docker, VueJS and scaling services, among many other things.
Want to stay up to date with new posts?
Stay up to date with new posts about Docker, Go, JavaScript and my thoughts on Technology. I post about twice per month, and notify you when I post. You can also follow me on my Twitter if you prefer.